Back

knowledge base

Dashboard Overview

Dashboard Overview

The Dashboard provides administrators with a high-level overview of reward activity, balances, spending, and outstanding obligations within Workbloom.

The Dashboard is designed to help administrators:

  • Monitor reward programme performance.  
  • Review spending trends.  
  • Track available balances.  
  • Identify outstanding funds due.  
  • Access detailed reporting data.  

Dashboard information is displayed through summary charts and visual reports that provide quick access to key programme metrics.

Tips

  • Review dashboard information regularly to monitor programme activity.  
  • Use dashboard summaries to identify trends before generating detailed reports.  
  • Access Full Report views for additional analysis.  

Common Mistakes

  • Assuming dashboard summaries contain all available reporting information.  
  • Ignoring outstanding balances or pending obligations.  
  • Relying solely on visual summaries without reviewing detailed reports.  

Related Articles

The Dashboard displays summary-level information through the following report widgets:

  • Total Reward Spend Summary

Provides a visual overview of reward spending over a selected date range.

Administrators can:

  • Select a ‘From’ and ‘To’ date range.  
  • Apply date filters.  
  • View spending trends.  
  • Open the Full Report for additional details.  
  • Export report information when available.  

  • Available Balance Summary

Displays the remaining available balance associated with campaigns and reward allocations.

Administrators can:

  • Review remaining funds.  
  • Identify campaigns with available balances.  
  • Open the Full Report for detailed information.  
  • Export report information when available.  

  • Reward Orders Summary

Provides a summary of reward orders processed within the platform.

Administrators can:

  • Review reward order activity.  
  • Monitor order volumes.  
  • Access detailed reporting through Full Report.  
  • Export report information when available.  

  • Total Rewards Value Summary

Displays the overall value of rewards distributed through the platform.

Administrators can:

  • Review total reward value.  
  • Filter results by reward type where available.  
  • Access additional reporting through Full Report.  
  • Export report information when available.  

  • Outstanding Funds Due Summary

Displays funds that remain outstanding across campaigns or reward programmes.

Administrators can:

  • Identify campaigns with outstanding balances.  
  • Review funds due amounts.  
  • Access detailed information through Full Report.  
  • Export report information when available.  
Workbloom dashboard report showing outstanding funds due summary

Tips

  • Review all dashboard widgets together to obtain a complete view of programme activity.  
  • Use Full Report options when detailed investigation is required.  
  • Monitor spending and outstanding balances regularly.  

Common Mistakes

  • Focusing on a single dashboard metric without reviewing related reports.  
  • Ignoring changes in available balances.  
  • Assuming dashboard data replaces detailed reporting.  

Related Articles

Certain dashboard widgets provide filtering options that allow administrators to focus on specific periods or data sets.

Depending on the report, available filters may include:

  • Date ranges.  
  • Reward categories.  
  • Reward delivery types.  
  • Other report-specific filtering options.  

Step-by-Step Instructions

  • Apply Filters

  1. Locate the desired dashboard widget.  
  1. Select the available filter options.  
  1. Enter or select the required values.  
  1. Select Apply.  
  1. Review the updated results.  

  • Clear Filters

  1. Remove selected filter values if applicable.  
  1. Reapply the report or refresh the widget.  
  1. Review the default dashboard view.  

Tips

  • Apply filters before exporting report data.  
  • Use date ranges to analyse specific reporting periods.  
  • Verify filter selections before sharing report results.  

Common Mistakes

  • Forgetting previously applied filters.  
  • Exporting filtered data without reviewing filter settings.  
  • Assuming filtered results represent all available data.  

Related Articles

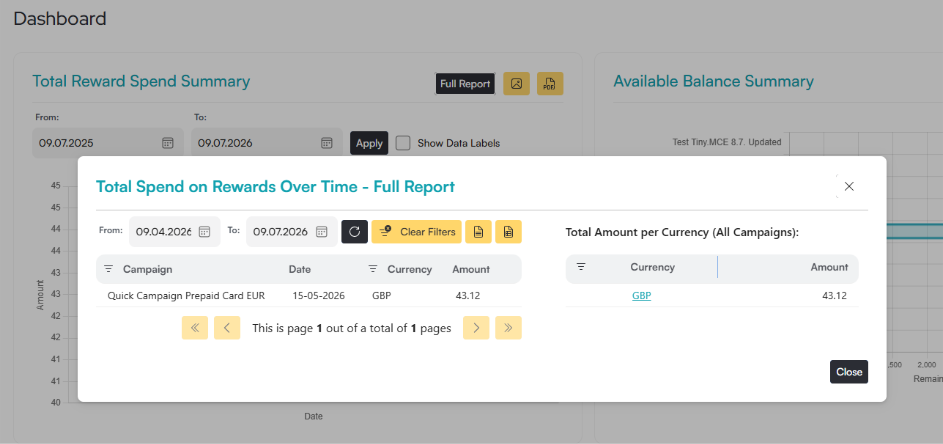
Each dashboard widget includes a Full Report option that opens the corresponding detailed report. Full reports provide additional information beyond the summary information displayed on the Dashboard.

Step-by-Step Instructions

  • Open a Full Report

  1. Navigate to Dashboard.  
  1. Locate the desired report widget.  
  1. Select Full Report.  
Dashboard page with a red arrow pointing to Dashboard in the sidebar and a red arrow pointing to the Full Report button

  1. Review the detailed report information.  
Total Spend on Rewards Over Time Full Report dialog

Detailed reports may include:

  • Additional reporting fields.  
  • Detailed transaction information.  
  • Filtering options.  
  • Export functionality.  

Tips

  • Use Full Report when detailed analysis is required.  
  • Review detailed data before making operational decisions.  
  • Use report exports when further analysis is required outside Workbloom.  

Common Mistakes

  • Assuming dashboard summaries contain all report data.  
  • Reviewing only visual charts without accessing the underlying report details.  
  • Exporting data without first validating report filters.  

Related Articles

Dashboard reports may include export options that allow administrators to download report data for further analysis.  

Please note that exporting is available only for Elevate, Amplify and Enterprise plans.

Available export formats may include:
  • PDF  
  • PNG
  • Excel (.xlsx)  
  • CSV

Step-by-Step Instructions

  • Export Dashboard Data

  1. Open the desired dashboard widget or Full Report.  
  1. Select the preferred export format.  
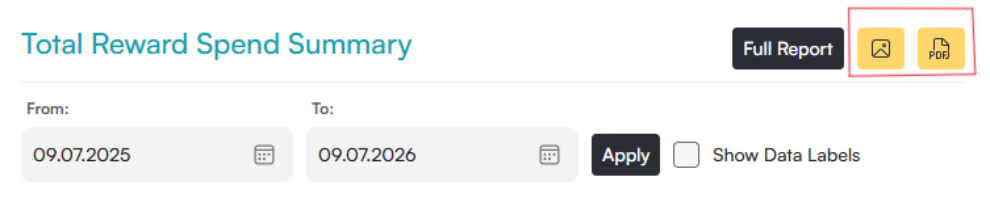
Total Reward Spend Summary section with a red box around two export buttons
Summary Report Exporting Buttons

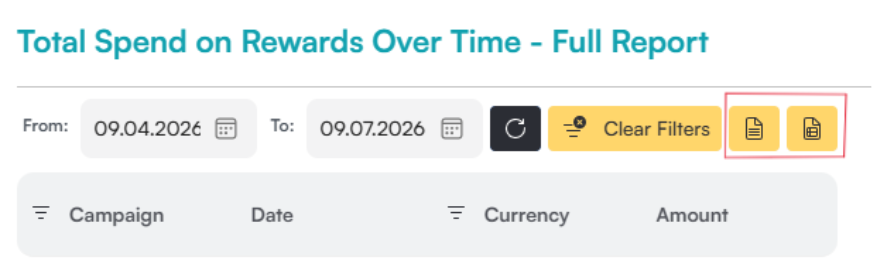
Total Spend on Rewards Over Time Full Report showing the two export buttons
Full Report Exporting Buttons

  1. Generate the export.  
  1. Save the exported file.  

Tips

  • Verify filters before exporting data.  
  • Use Excel exports for data analysis.  
  • Use PDF exports for reporting and sharing.  

Common Mistakes

  • Exporting outdated report results.  
  • Forgetting to apply the required filters before export.  
  • Assuming exported reports update automatically after download.  

Related Articles